Key Takeaways
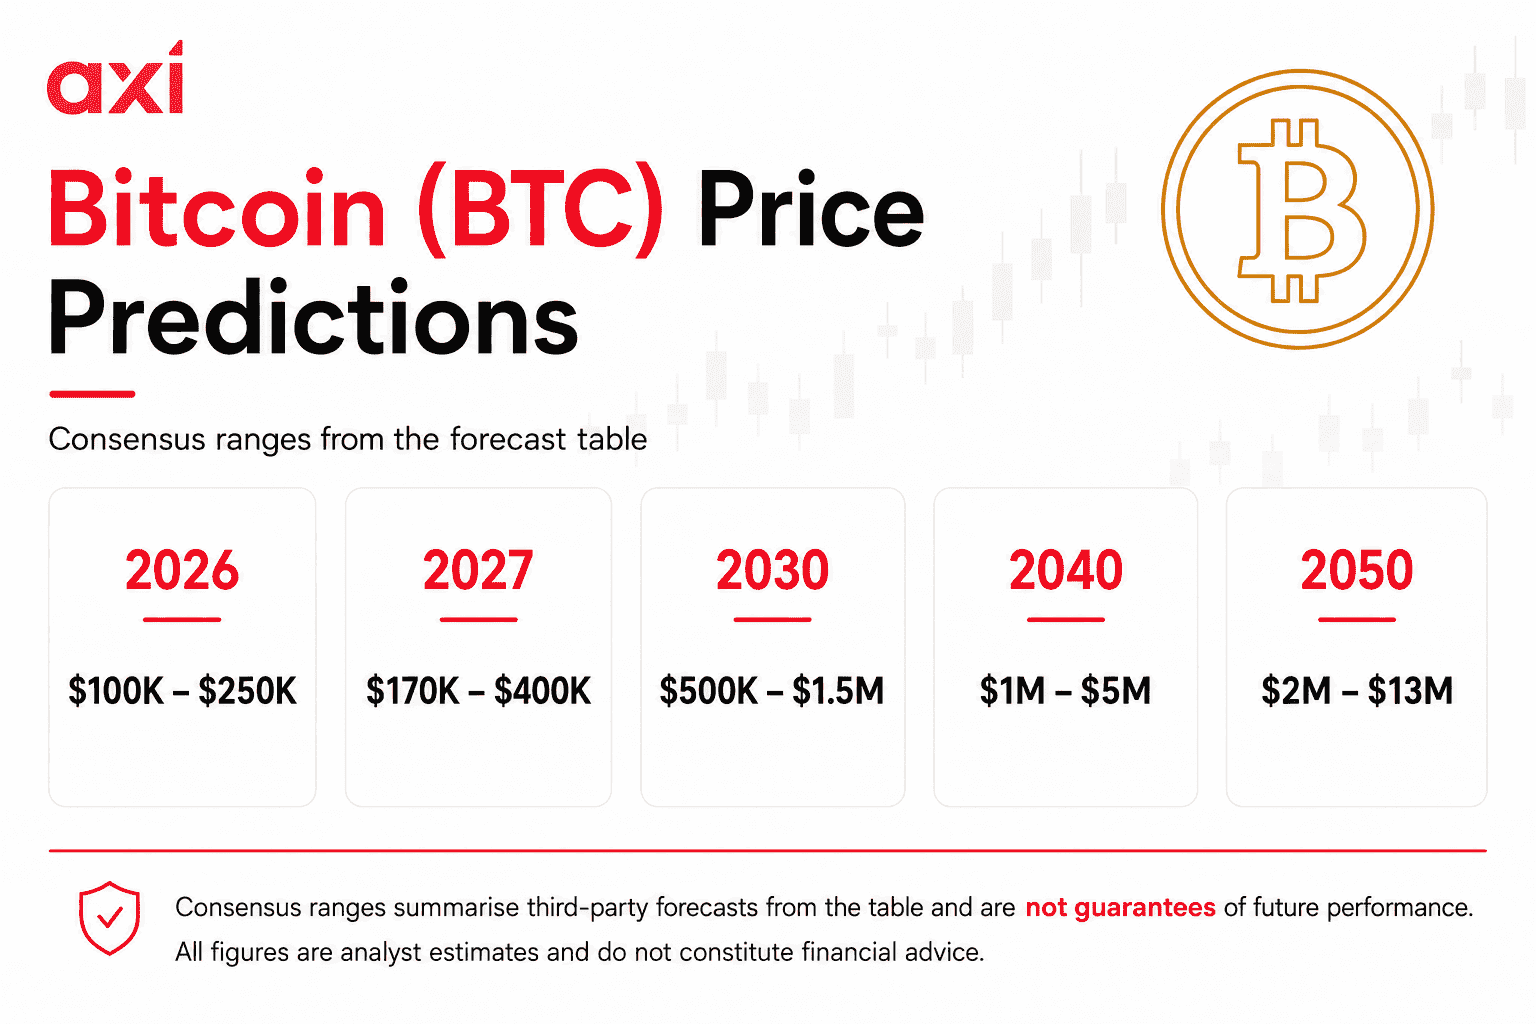
- 2026 Forecasts: Published 2026 targets vary widely, with some institutions revising their targets lower during the year. These are competing scenarios, not a market consensus.
- 2027 Outlook: Forecasts differ substantially across publishers and algorithmic models. Estimates also change over time, so publication dates and assumptions matter.
- 2030 Outlook: ARK Invest's published 2030 scenarios range from roughly $300,000 to $1.5 million, with a base case near $710,000. Other models differ markedly.
- 2040+ Long-Term View: Far-dated projections are especially uncertain. Institutional scenarios, algorithmic estimates and highly speculative publisher extrapolations should not be treated as a single forecast range.
- Drivers & Risks: Bitcoin's capped supply, halving schedule and access through investment products can influence demand; regulation, liquidity, macroeconomic conditions and severe drawdowns remain important risks.
- Trade Bitcoin with Axi: Trade Bitcoin your way. Speculate on price movements with CFDs or Perpetual Futures using leverage, or buy and hold the underlying asset with Spot Crypto. View live price charts and data on our dedicated Bitcoin trading page.
Table of contents
- Bitcoin core fundamentals
- What affects Bitcoin's price?
- Historical price performance
- The current state of Bitcoin (2026)
- Bitcoin price prediction 2026-2050
- Forecast methodology
- How 2025 Bitcoin price predictions played out
- BTC price prediction 2026
- BTC price prediction 2027
- BTC price prediction 2030
- BTC price prediction 2040
- BTC price prediction 2050
- Conclusion
Bitcoin core fundamentals
At its core, the Bitcoin blockchain is a public, decentralised digital ledger that records every transaction. It is maintained not by a single entity but by a global network of computers, or nodes, that work together to keep the system secure.
Transactions are bundled into blocks. Each block contains a limited number of entries and a unique cryptographic code that links it to the previous block, forming a continuous chain of data. To add a new block to the chain, miners compete to solve complex cryptographic puzzles using specialised hardware. The first to find the solution earns the right to add the new block and is rewarded with newly created bitcoins along with transaction fees.
Scarcity and the halving cycle
Bitcoin's fixed maximum supply of 21 million coins is a fundamental design feature that creates absolute scarcity. No central bank, government, or developer can alter this cap, which is why BTC is increasingly compared to gold as a long-term store of value.
Bitcoin scarcity is reinforced by a mechanism known as the halving cycle. Approximately every 210,000 blocks, or roughly every four years, the reward given to miners for adding a new block is cut in half. These scheduled reductions limit the rate at which new bitcoins are created and released into circulation.
Since Bitcoin's launch in 2009, block rewards have steadily decreased, starting at 50 bitcoins per block. They were then reduced to 25, then to 12.5, and later to 6.25. The most recent halving occurred in April 2024, reducing the reward to its current level of 3.125 bitcoins per block.
It is important to note that block rewards are the only way new bitcoins enter circulation.
Unlike traditional fiat currencies, where central banks can increase the money supply at will, Bitcoin's supply schedule is strictly predetermined by its code.
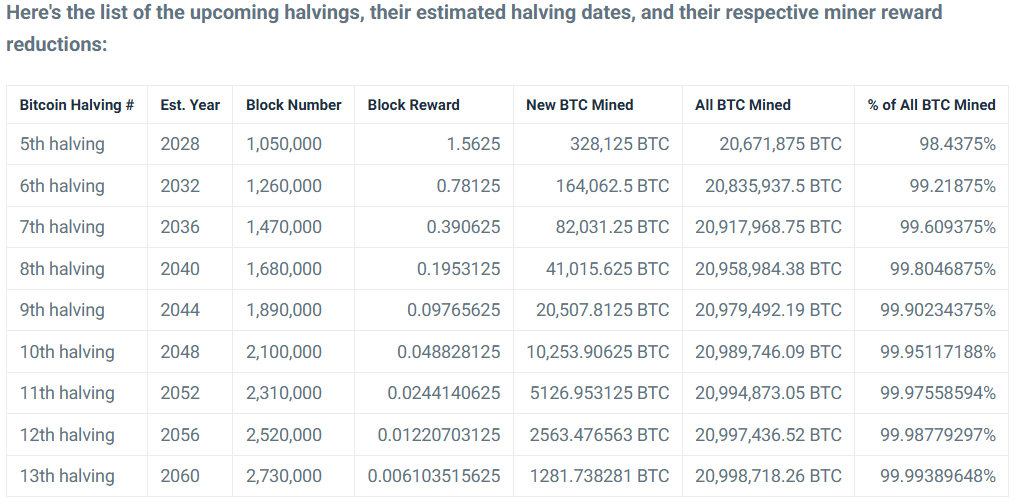
Bitcoin Halving Dates: When Is the Next BTC Halving? |CoinCodex
On-chain metrics
Because the Bitcoin blockchain is public, anyone can access and analyse its transaction history. This has given rise to on-chain analysis, a method that uses publicly available blockchain data to understand network activity and user behaviour.
This type of analysis provides insight into how Bitcoin is being used, stored, and transferred. Analysts can track metrics such as transaction volume, the number of new and active addresses, exchange inflows and outflows, hash rate, and miner activity. By combining these signals, researchers can identify trends that may signal shifts in market sentiment or broader network dynamics that may influence price trends.
What affects Bitcoin's price?
BTC is famously volatile and speculative, but its price movements are not random. They result from the interaction between supply and demand, influenced by a combination of economic, technological, and psychological factors. These include:
- Scarcity and the halving cycle: Bitcoin's fixed supply is its primary support for long-term growth. Approximately every four years, the halving cycle reduces the rate of new supply entering circulation. Historically, these events have coincided with major market cycles.
- Adoption and institutional investment: The adoption of Bitcoin as a store of value or medium of exchange can significantly influence its price. When large institutions and investment vehicles such as exchange-traded funds (ETFs) enter the market, they increase liquidity and strengthen Bitcoin's position as a recognised asset class.
- Market sentiment and psychology: In the fast-paced crypto market, sentiment and narratives can move the price as much as fundamentals. Positive news can trigger buying momentum, while negative headlines can lead to rapid selloffs.
- Regulation and policy: Regulatory developments can significantly influence Bitcoin's price. Uncertainty or sudden policy changes often increase volatility, while clearer frameworks may encourage institutional participation and broader market adoption.
- Technological developments: Improvements to Bitcoin's infrastructure, including scaling solutions and network upgrades, can influence its perceived value and usability over time.
- Macroeconomic conditions: Some investors increasingly view Bitcoin as a potential hedge against inflation and economic instability. Periods of currency devaluation, high inflation, or geopolitical tension can increase interest in alternative stores of value such as BTC.
Historical price performance
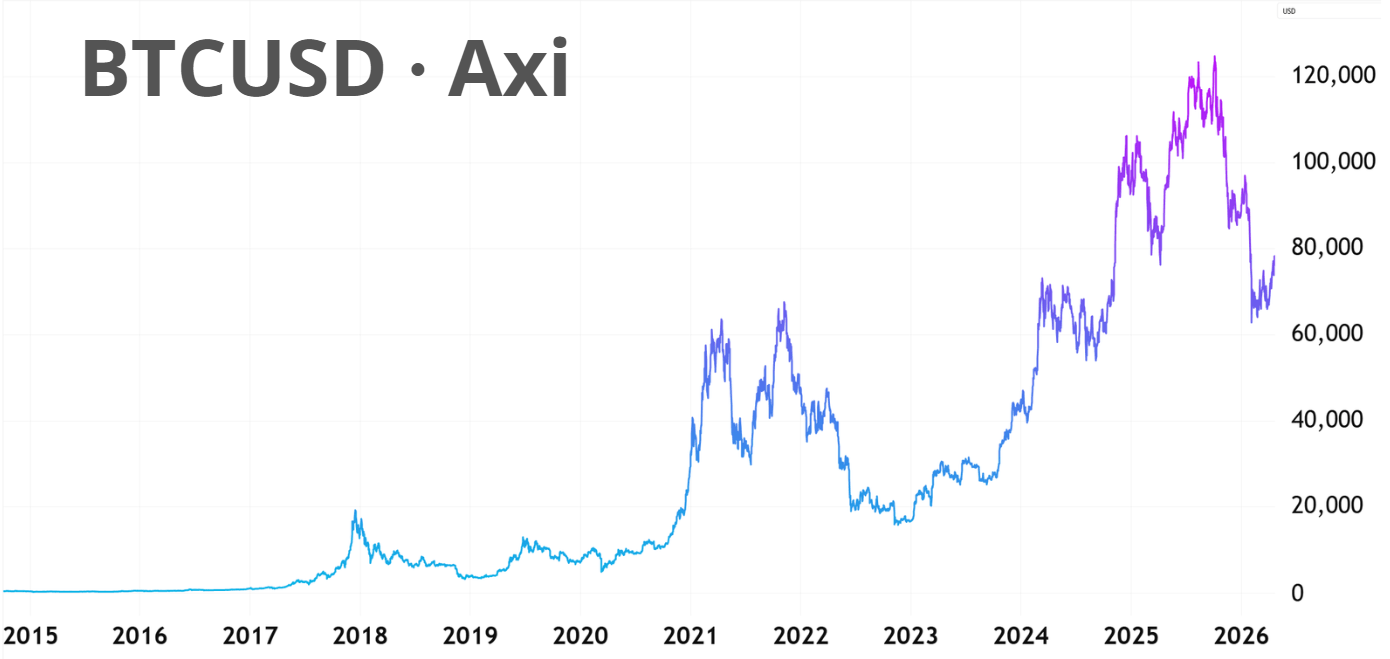
Lowest and highest prices yearly since 2010
| Year | Lowest Price (USD) | Highest Price (USD) | Average Price* (USD) |
|---|---|---|---|
| 2010 | 0.05 | 0.46 | 0.14 |
| 2011 | 0.25 | 35.88 | 5.85 |
| 2012 | 3.77 | 17.76 | 8.36 |
| 2013 | 11.59 | 1,156.14 | 192.65 |
| 2014 | 289.30 | 1,017.12 | 527.24 |
| 2015 | 171.51 | 495.56 | 272.45 |
| 2016 | 354.91 | 979.40 | 568.49 |
| 2017 | 755.76 | 20,089.00 | 4,006.03 |
| 2018 | 3,191.30 | 17,712.40 | 7,572.91 |
| 2019 | 3,391.02 | 13,796.49 | 7,395.25 |
| 2020 | 4,106.98 | 29,244.88 | 11,116.38 |
| 2021 | 28,722.76 | 68,789.63 | 47,436.93 |
| 2022 | 15,599.05 | 48,086.84 | 28,197.88 |
| 2023 | 16,521.23 | 44,705.52 | 28,859.47 |
| 2024 | 38,521.89 | 108,268.45 | 65,964.11 |
| 2025 | 74,436.68 | 126,198.07 | 101,642.00 |
| 2026 (YTD) | 57,747.77 | 97,860.60 | ~73,975 (YTD) |
*Annual averages are the arithmetic mean of available daily closing prices; yearly lows/highs are intraday values. Data: StatMuse BTC historical prices (2010 data begin in July). The 2026 average is an approximate year-to-date figure through 28 October 2026, cross-checked against daily closing prices. Bitcoin traded in 2009, but comparable continuous daily market data are not available for that year. Different exchanges and price providers may report slightly different highs and lows.
Previous cycles' highs and lows
| Year | High | Year | Low | Pullback % |
|---|---|---|---|---|
| 2013 | 1,156.14 | 2015 | 171.51 | -85% |
| 2017 | 20,089.00 | 2018 | 3,191.30 | -84% |
| 2021 | 68,789.63 | 2022 | 15,599.05 | -77% |
| 2025 | 126,198.07 | 2026 (current cycle) | 57,747.77 | -54% |
Few assets have matched Bitcoin's capacity for both extraordinary gains and brutal losses. Each bull market has delivered remarkable returns, only to be followed by sharp corrections. Historically, Bitcoin has retraced between 70% and 85% from previous all-time highs, though both the percentage gains and the depth of corrections have been gradually diminishing with each successive cycle.
Early years (2009-2012)
Bitcoin's first reported exchange rate was less than a tenth of a penny in 2009. By 2011, it had reached $1 as early adoption began. Following the first halving in November 2012, the price climbed from around $11 to over $1,100 within a year. A steep correction followed, with Bitcoin falling around 85% from its 2013 high to near $172 in early 2015 on the historical series used above.
2016-2018 bull run
The second halving occurred in July 2016, setting the stage for the next bull market. Bitcoin climbed from about $600 to nearly $20,000 by December 2017, an astounding gain of more than 3,000%. By the end of 2018, it had collapsed to $3,200, an 84% correction that marked the start of the next "crypto winter".
2020-2022: Record high and subsequent downturn
The third halving took place in May 2020, and Bitcoin rallied from below $9,000 to a new all-time high of nearly $69,000 in November 2021, a gain of around 650%. At its peak, the asset's market capitalisation briefly exceeded $1.25 trillion. A sharp downturn followed, with the price dropping 77% to nearly $15,000 by November 2022.
2023-present: The fourth cycle
Bitcoin began its recovery in January 2023. The fourth halving took place on 20 April 2024, when Bitcoin traded around $64,500. It had moved back above $40,000 earlier that year after the 2022 bear market. In October 2025, BTC reached a new high near $126,198 on the price series used in the table above. During 2026, it fell as low as approximately $57,748 before rebounding; the corresponding peak-to-trough decline was around 54%.
Volatility and market evolution
Bitcoin remains highly volatile, with sharp rallies and drawdowns even as the market has developed. Volatility creates trading opportunities but also the risk of substantial losses; large price swings do not make future recoveries more certain.
Past Bitcoin downturns have coincided with failures among highly leveraged or poorly managed crypto businesses. Some firms have survived and grown after these periods, while others have not. Previous market cycles do not establish that a future downturn will strengthen the sector or lead to higher prices.
The current state of Bitcoin (2026)
Bitcoin supply dynamics and market structure in 2026 show a mixed but structurally tight environment. Reserves on centralised exchanges remain at their lowest levels since 2018, indicating strong accumulation and a shift toward self‑custody by both retail and institutional holders. At the same time, on‑chain data suggest that some long‑term investors and large holders have partially liquidated or rebalanced positions since 2024, as earlier‑cycle participants take profits and adjust portfolios. Most of the total BTC supply is still owned by long-term investors, which leads to a limited supply that can affect prices in spot markets, perpetuals, and leveraged instruments.
ETF-driven institutional flows
The launch of Bitcoin ETFs in early 2024 was a major turning point for the crypto market, providing traditional investors with regulated, custodied exposure to Bitcoin without the need to manage wallets or self‑custody. ETF demand has remained an important source of buying pressure on spot markets, though flows have become more volatile and sensitive to macro and price conditions.
Cumulative inflows into spot Bitcoin ETFs now exceed $50 billion since launch, with the majority arriving in 2024 and 2025. A substantial portion of that (around $14–15 billion) entered the market in 2025 alone, with demand spiking notably in July following a series of pro‑crypto legislative and regulatory developments in the US. In 2026, flows have turned more mixed as investors rotate in and out of risk assets, with episodes of both inflows and outflows. ETF-backed holdings nevertheless remain a structurally important source of demand, continuing to shape pricing, liquidity, and overall market activity.
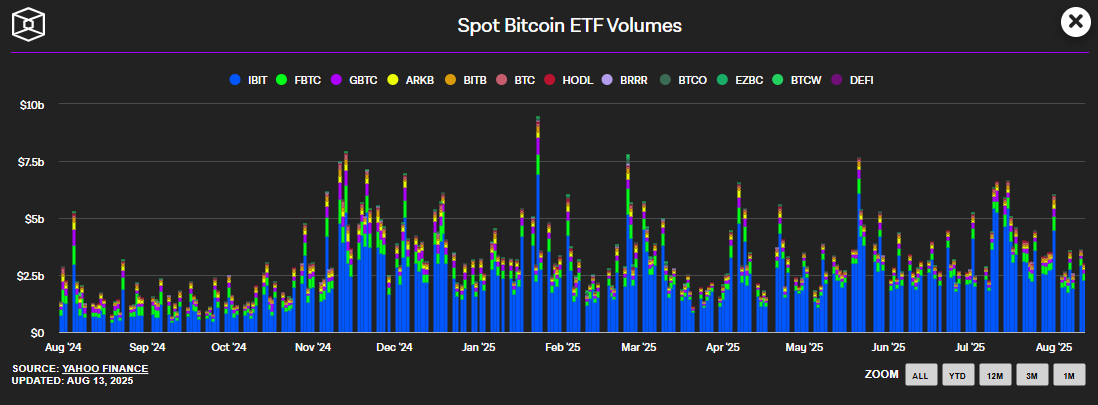
Spot Bitcoin ETF Volumes Daily Chart: BlackRock, Fidelity and More
Regulatory developments and uncertainty
Policy announcements and changes in US regulatory priorities have influenced crypto-market sentiment and positioning. Their effects on Bitcoin demand and prices are not straightforward, and several legislative initiatives remain subject to debate or implementation risk.
This shift is anchored in several key developments:
- The GENIUS Act, which mandates 1:1 stablecoin backing and introduces federal oversight for dollar‑pegged stablecoins.
- The planned Strategic Bitcoin Reserve, initially proposed to be capitalised with 200,000 seized BTC, though its final structure and implementation are still under review.
- The appointment of a new "Crypto Czar", tasked with coordinating a more modern, integrated regulatory framework across federal agencies.
- A pause or winding down of many enforcement actions initiated under prior SEC leadership, which has reduced near‑term regulatory overhang for some market participants.
At the same time, the Clarity Act, intended to provide clearer rules for digital‑asset markets, has stalled in the Senate, largely due to disputes over whether stablecoins should be allowed to generate yield for holders. This demonstrates that the broader regulatory picture remains uneven, with supportive measures coexisting with ongoing legislative and political uncertainty.
Derivatives-linked equities outperforming
Bitcoin‑linked equities such as Coinbase, MicroStrategy, and major mining names have shown a mixed but often leveraged relationship with BTC in 2026. Periods of strong Bitcoin rallies have frequently translated into sharper gains in these stocks, at times pushing their price‑returns above those of BTC itself, particularly when ETF‑driven flows and macro‑risk‑on sentiment coincide. However, they also tend to correct more sharply on BTC pullbacks, so while they can act as performance‑amplified proxies for Bitcoin, the outperformance is episodic rather than consistent across the full 2026 cycle.
Post-crisis recovery and market maturity
The 2022 collapses of FTX, Terra and other crypto businesses triggered widespread deleveraging. Since then, institutional participation and some custody practices have evolved, but counterparty risk, price volatility and liquidity gaps remain material concerns for traders.
Macro positioning and portfolio inclusion
Bitcoin remains a major digital asset by market capitalisation. Some investors regard it as a potential hedge against monetary instability, while others question its reliability in that role because of sharp drawdowns and changing correlations. Its market behaviour remains sensitive to liquidity and broader risk appetite.
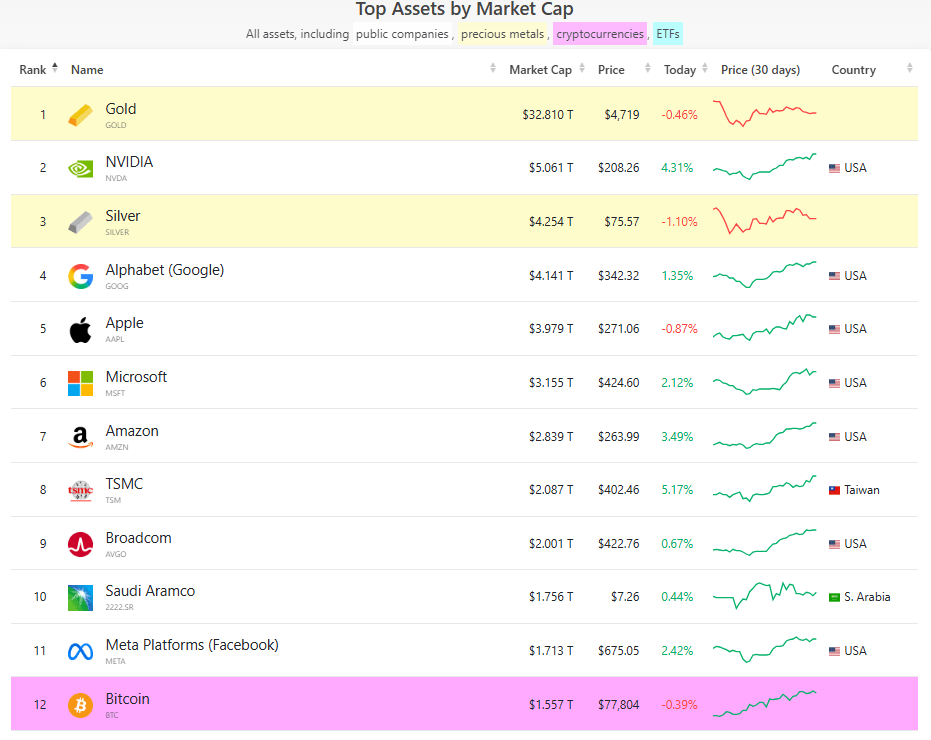
Assets ranked by Market Cap - CompaniesMarketCap.com
Bitcoin price prediction 2026-2050
| Source | 2026 | 2027 | 2030 | 2040 | 2050 |
|---|---|---|---|---|---|
| CoinCodex (Aug 2026) | $63.8K to $87.4K | $56K to $88K | Approx. $252K | Approx. $1.19M | Approx. $1.31M |
| VanEck | Bear $130K Base $2.9M Bull $53.4M | ||||
| Coinpedia | $100K to $180K Average $150K | $170K to $330K Average $250K | $380K to $900K Average $750K | $5.8M to $13.5M Average $9.6M | $162M to $378M Average $270M |
| Cryptonews (29 Oct 2026) | $81.7K to $82.8K | $83.9K to $89.4K | $98.6K to $141.8K | ||
| Fundstrat (Tom Lee, earlier 2026 call) | $200K to $250K | ||||
| Robert Kiyosaki | $250K | $1M | |||
| Standard Chartered (Feb 2026 update) | $100K | $500K | |||
| Mike McGlone (Bloomberg) | $10K to $65K | ||||
| ARK Invest | Bear $300K Base $710K Bull $1.5M | ||||
| Tim Draper | $250K | ||||
| Traders Union (29 Oct 2026) | $80K to $83K | Approx. $55.7K | Approx. $97.2K | Approx. $234K |
Blank cells mean no year-specific target is listed for that source. Estimates use different methods and publication dates, and regularly updated models can change. These are third-party scenarios, not Axi predictions or financial advice.
Updated model sources (checked 29 October 2026): Cryptonews and Traders Union. Institutional scenarios: VanEck (2050) and ARK Invest (2030).
Forecasts for other target years
| Source | Target date | BTC forecast | Context |
|---|---|---|---|
| Pantera Capital | April 2028 | $740,000 | Conditional trend scenario. Dan Morehead said it might take longer. |
| Bitwise | 2036 | $1.6 million | Updated 28 October 2026. Previously $1.3 million by 2035. |
| Michael Saylor | 2045 | $13 million | Base-case scenario presented in July 2024. |
Long-term forecast caution: VanEck's 2050 bear, base and bull cases come from published research. Coinpedia's much higher 2040 and 2050 estimates are speculative publisher projections. Neither represents market consensus. Bitcoin Rainbow and Stock-to-Flow charts illustrate models, not reliable year-specific price targets.
Forecast methodology
The table brings together dated institutional research, publisher estimates, algorithmic snapshots and individual forecasts for the years shown. Different sources use different methods and publication dates, so the figures should be compared as separate scenarios rather than combined into a market consensus.
How we chose the forecasts
We prioritise forecasts with identifiable sources, stated target years and publicly available assumptions, including research from VanEck, Standard Chartered and ARK Invest. We also show selected dated snapshots of regularly updated algorithmic or publisher models, such as CoinCodex, Cryptonews, Coinpedia and Traders Union. These are different kinds of evidence and should not be weighted equally.
Promotional claims, undated model outputs and extremely speculative extrapolations are not treated as an institutional consensus. Forecasts for other target years appear in the separate table above.
Dates and outdated calls
Forecasts change as market conditions change. Institutional research is referenced to the publication date available from the source; rapidly updated sites may show different values when revisited. The CoinCodex row is an August 2026 snapshot, while the Cryptonews and Traders Union rows use their late-October 2026 forecasts. Older or mismatched-year calls are separated from the year-specific comparison.
From forecasts to bull, base and bear cases
Bull, base and bear scenarios describe alternative assumptions, not probability-weighted predictions. Where a source publishes its own bear/base/bull cases (such as ARK Invest or VanEck), the figures are attributed to that source. Axi has not calculated a separate weighted consensus range from the entries in the table.
Very high long-term estimates can depend on speculative assumptions about widespread monetary adoption. They are retained only as clearly identified third-party scenarios and should not be taken as evidence that Bitcoin is likely to reach those values.
What this does (and doesn't) mean
All of these numbers are estimates, and their sources have different assumptions. Bitcoin has experienced multiple drawdowns exceeding 70% in past cycles; the latest 2025-2026 peak-to-trough decline was around 54% on the price series shown above. None of these scenarios is a reliable prediction of future performance or financial advice. Consider your objectives, risk tolerance and independent research before any trading or investment decision.
How 2025 Bitcoin price predictions played out
Heading into 2025, several widely reported bullish targets were in the $150,000-$250,000 range, including Bitwise ($200,000), Standard Chartered ($200,000) and VanEck ($180,000). Those targets went unmet. Bitcoin's annual high was around $126,198 in October 2025 on the historical series used here. The gap is a reminder that even well-known analysts can miss year-end targets by a substantial margin.
Other prominent bullish targets, including Fundstrat's Tom Lee, Robert Kiyosaki, Arthur Hayes and Tim Draper, also exceeded the realised 2025 high. Very high forecasts associated with Adam Back or Stock-to-Flow-style models should be distinguished from dated year-end research targets. Individual forecasts can become outdated quickly, and past misses are not proof of future price direction.
BTC price prediction 2026
Forecasts for Bitcoin in 2026 vary considerably, with some analysts maintaining six-figure targets while others have revised them lower. Bitcoin traded near $81,000 on 28 October 2026, so earlier year-end calls would require different degrees of recovery to materialise. Outcomes also depend on ETF flows, institutional demand, macroeconomic conditions and risk sentiment; the forecasts do not amount to a bullish consensus.
Standard Chartered reduced its end-2026 Bitcoin target from $150,000 to $100,000 in February 2026 and reiterated that figure later in the year, while acknowledging that stronger ETF flows could produce a higher outcome. Earlier forecasts from Fundstrat's Tom Lee were more bullish, at $200,000-$250,000, but are included here as dated analyst views rather than current consensus estimates.
Publisher and algorithmic models also vary. Coinpedia lists a $100,000-$180,000 range for 2026, while the August 2026 CoinCodex snapshot was lower, at roughly $63,800-$87,400. Cryptonews' late-October model projects approximately $81,700-$82,800 for year-end 2026. These changing estimates should be read with their dates; they do not represent a single forecast or guarantee.
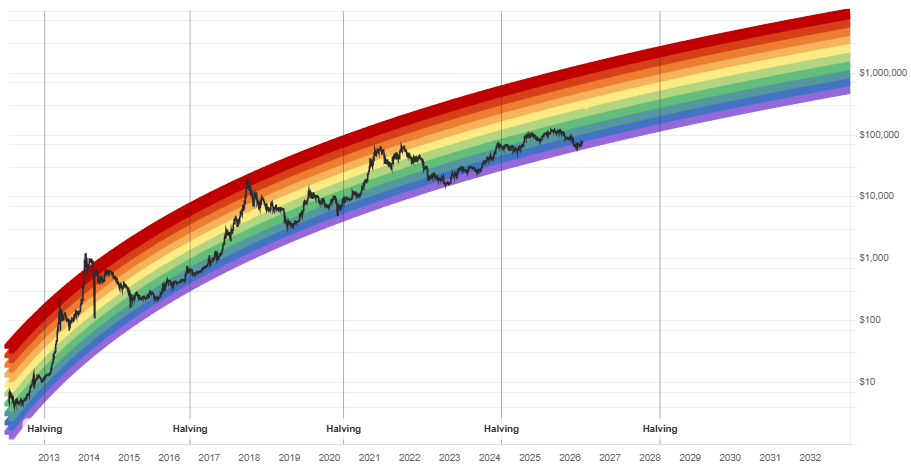
The Bitcoin Rainbow Chart shown below is a visual historical valuation model. Its colour bands and extrapolations should not be interpreted as verified year-end price targets.
On the bearish side, Mike McGlone from Bloomberg Intelligence warns that Bitcoin could fall toward $10,000 in a severe macro downturn, while identifying $50,000 to $65,000 as a more realistic lower support range if liquidity tightens.
Sources
https://x.com/coinbureau/status/2004515034354061585?s=20
https://coinpedia.org/price-prediction/bitcoin-price-prediction/
https://coincodex.com/crypto/bitcoin/price-prediction/
https://cryptonews.net/news/bitcoin/32604285/
Bitcoin Rainbow Chart - Blockchaincenter
https://cryptonews.net/news/bitcoin/32247942/
https://finance.yahoo.com/news/robert-kiyosaki-predicts-bitcoin-soar-171629682.html
BTC price prediction 2027
Bitcoin forecasts for 2027 are mixed rather than uniformly bullish. Some sources anticipate stronger adoption and continued growth, while shorter-term models allow for stagnation or lower prices. Figures are highly sensitive to the date and method used.
Bernstein forecasts Bitcoin reaching $150,000 by mid-2027 under its base case, with a more bullish scenario of $200,000 if institutional demand accelerates.
Coinpedia published a $170,000-$330,000 range for 2027, with an average around $250,000. In contrast, Traders Union's updated October 2026 model suggests approximately $55,700 by year-end 2027. These estimates reflect substantially different assumptions and should not be presented as a consensus.
The August 2026 CoinCodex algorithmic snapshot put 2027 between roughly $56,000 and $88,000. Cryptonews' late-October 2026 model projects about $83,900-$89,400. Both are dynamic estimates that can change when the underlying models are refreshed.
More optimistic commentators have discussed prices of $500,000 or higher within a future cycle. For example, Adam Back discussed a $500,000-$1 million cycle scenario in 2025 without specifying a firm 2027 year-end target; it is therefore not assigned to 2027 in the comparison table.
In summary, the published 2027 estimates shown here remain widely dispersed. Institutional adoption, market liquidity and Bitcoin's supply schedule all feature in their assumptions, but neither a central target nor a dominant direction can be inferred reliably from this small, heterogeneous selection.
https://tradersunion.com/currencies/forecast/btc-usd/
BTC price prediction 2030
Looking toward 2030, after the expected 2028 halving, forecasts span a wide range. The central questions are how much Bitcoin adoption grows and whether its role in institutional portfolios and payments expands; neither is assured.
Coinpedia publishes a 2030 range of $380,000-$900,000, with an average near $750,000. Standard Chartered's long-term research has put Bitcoin at $500,000 by 2030. Pantera Capital also published a conditional $740,000 scenario for April 2028, a different target year.
ARK Invest's research places Bitcoin around $710,000 by 2030 as a base case, with a bear case near $300,000 and upside scenarios toward $1.5 million if adoption accelerates more quickly than expected. These projections are based on Bitcoin's growing use in institutional portfolios, corporate treasuries, and as a non-sovereign store of value.
Other publisher and algorithmic estimates are much lower: the August 2026 CoinCodex snapshot puts 2030 at around $252,000, while Traders Union's late-October 2026 model estimates around $97,200. Such models can change frequently and are not directly comparable with institutional valuation scenarios.
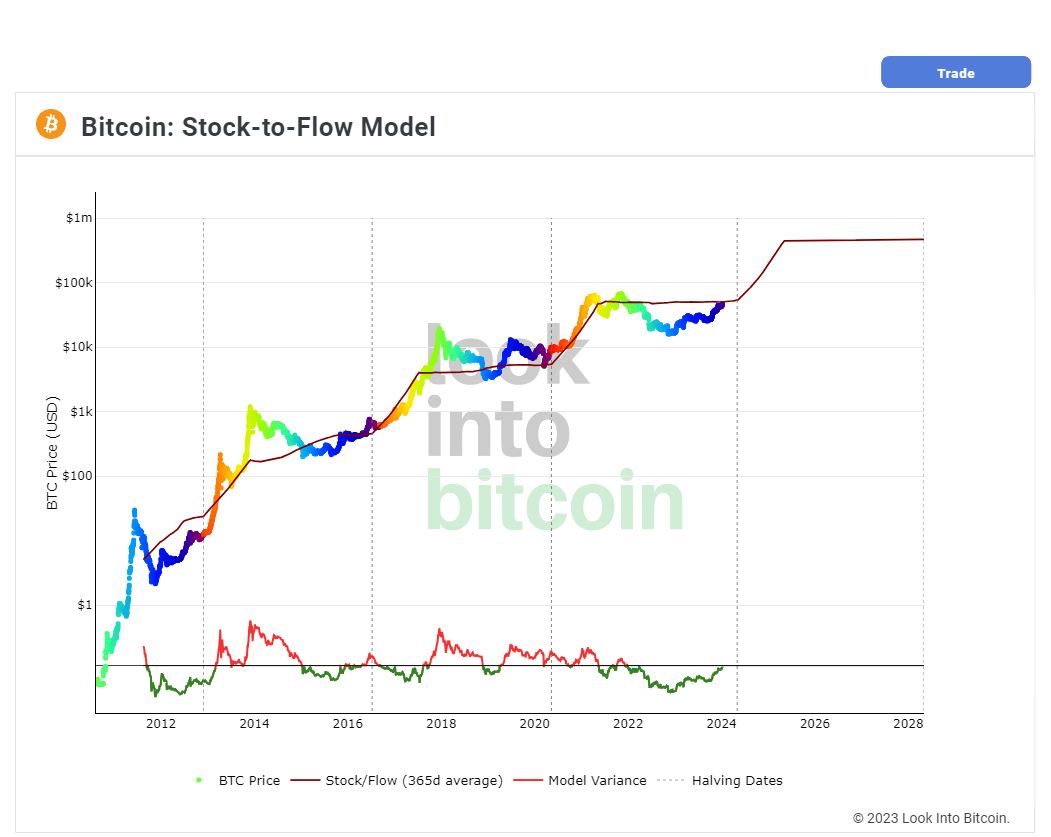
The Stock-to-Flow chart below illustrates a scarcity-based model that has attracted significant debate over its assumptions and forecasting record. An undated model extrapolation should not be treated as a verified 2030 price target.
In summary, 2030 estimates differ sharply by methodology. ARK Invest's published research sets out bear, base and bull scenarios of approximately $300,000, $710,000 and $1.5 million, while other models forecast much lower outcomes. The numbers are scenarios, not an agreed market price target.
https://www.ark-invest.com/articles/valuation-models/arks-bitcoin-price-target-2030
https://x.com/coinbureau/status/2004515034354061585?s=20
Kiyosaki Predicts Bitcoin at $1 Million by 2030 as Economic Crisis Looms. How High Can BTC Price Go?
Stock to Flow Price Predictions
Stock-to-Flow Model | LookIntoBitcoin
BTC price prediction 2040
By around the 2040 halving, approximately 99.6% of Bitcoin's maximum supply is scheduled to have been mined, assuming the protocol's current issuance rules. Forecasting its price at that horizon is highly speculative: monetary adoption, regulation, market structure and real-world demand cannot be known in advance.
CoinCodex's August 2026 model snapshot put Bitcoin near $1.19 million in 2040. That algorithmic extrapolation should not be confused with a dated institutional price target.
Coinpedia publishes a much higher 2040 range of roughly $5.8 million-$13.5 million, averaging near $9.6 million. These figures are highly speculative publisher extrapolations. At the other end, Traders Union's updated late-October 2026 statistical model projects around $234,000 by 2040.
Other optimistic commentators have discussed multi-million-dollar outcomes, generally without verified 2040 deadlines. Those comments are not included as precise 2040 predictions in the table.
In summary, 2040 estimates span very different assumptions and confidence levels. The presence of several large model outputs does not establish that multi-million-dollar Bitcoin prices are the most likely outcome.
https://coinpedia.org/price-prediction/bitcoin-price-prediction/
BTC price prediction 2050
Looking toward 2050, forecasts diverge sharply because they assume very different future roles for Bitcoin. At this distance, even small changes in assumptions about adoption, regulation or market size can lead to very large differences in modelled values.
VanEck's January 2026 long-term valuation framework models Bitcoin at $130,000 in its bear case, $2.9 million in its base case and $53.4 million in its bull case for 2050. The $2.9 million base case assumes use in international trade and central-bank reserves and implies roughly 15% annualised growth from its December 2025 baseline. These are conditional scenarios, not forecasts with known probabilities.
Michael Saylor separately described a $13 million base-case Bitcoin scenario for 2045 in 2024. That scenario applies to 2045 and is not directly comparable with the 2050 estimates above.
Coinpedia's 2050 extrapolation is far more speculative, with a published range of about $162 million-$378 million and an average near $270 million. These extraordinary figures depend on assumptions about Bitcoin's future economic role and should not be conflated with VanEck's institutional valuation framework.
In summary, the 2050 figures shown here are not a reliable consensus. VanEck's published bear, base and bull cases differ greatly from the much larger long-run Coinpedia extrapolations. Actual market prices may diverge substantially from all of these estimates.
(5) VanEck & Michael Saylor: $2.9M Bitcoin Changes the Game for Preferred Investors | LinkedIn
Conclusion
Bitcoin's long-term price trajectory remains highly uncertain. The forecasts discussed here reflect differing assumptions, methodologies and target dates, not a directional consensus that its price must rise over each horizon.
Bitcoin's capped supply and predictable issuance are important features of its design, while its future demand will depend on adoption, liquidity, policy and competing assets. Previous cycles do not guarantee progressively shallower drawdowns or higher future prices.
Volatility, macroeconomic shocks and regulatory uncertainty remain material risks. Long-term scenarios are highly sensitive to their assumptions; they should be assessed critically alongside the possibility of significant losses.
References to forecasts and past performance are not reliable indicators of future results.
The images shown are for illustration purposes only. Data is sourced from third party providers.
This information is for educational purposes only and is not intended to be financial product advice or any investment recommendation. It is not to be construed as a recommendation; or an offer to buy or sell; or the solicitation of an offer to buy or sell any security, financial product, or instrument; or to participate in any trading strategy. It has been prepared without taking your objectives, financial situation and needs into account. Axi makes no representation and assumes no liability with regard to the accuracy and completeness of the content in this publication. Readers should seek their own advice.

Alex Macris
With a background spanning forex, stocks, and crypto, Alex has contributed financial and stock exchange reports to leading publications and news agencies. Beyond financial markets, he honed his skills by researching and editing international agreements and state reports and producing multimedia resources for diverse brands and organisations.
In addition to written content, Alex, who is fluent in English, French, and Greek, brings extensive experience and passion for audio. His portfolio showcases a versatile skill set encompassing podcast production, educational materials, and advertisements. A team player and lifelong learner, he maintains a balanced perspective on both the big picture and the finer details.
Find him on: LinkedIn